Home / Sample Solution: Geospatial Intelligence with Machine Learning in the Cloud
The DAIR Program is longer accepting applications for cloud resources, but access to BoosterPacks and their resources remains available. BoosterPacks will be maintained and supported until January 17, 2025.
After January 17, 2025:
Screenshots should remain accurate, however where you are instructed to login to your DAIR account in AWS, you will be required to login to a personal AWS account.
Links to AWS CloudFormation scripts for the automated deployment of each sample application should remain intact and functional.
Links to GitHub repositories for downloading BoosterPack source code will remain valid as they are owned and sustained by the BoosterPack Builder (original creators of the open-source sample applications).
The Geospatial-AI lnformation Toolbox (GAIT)
A Cloud-based Platform for Geospatial Intelligence with Machine Learning
This Sample Solution, the Geospatial-AI lnformation Toolbox (GAIT) BoosterPack, is a cloud-based platform for Geospatial Intelligence with machine learning (ML). It demonstrates how Ecosystem Informatics Inc. built a modular, scalable, cloud-based platform that provides an alternative to more expensive, proprietary software suites.
Problem Statement
Many intelligent and big data applications with geospatial intelligence capabilities use multiple infrastructure components like databases to store data, source code repositories for Artificial Intelligence (AI) and other data processing modules, a visualization engine for geospatial mapping, and many others.
There is a significant need for an open-source cloud platform that includes several of these core components, built with a microservices architecture that allows scalability and modularity across all components. There is also a need for efficient code integration and deployment within the cloud. This need is shared across several types of businesses and industries.
Traditional methods include setting up the requisite system components individually, which can prove to be time consuming and costly when involving proprietary software and data services. Further, data formats are often difficult to share and use between the various applications used by GIS analysts. You could opt for several independent applications that are not highly integrated, or highly integrated applications like ESRI, with costly SaaP and DaaP plans that may deter young companies.
This Sample Solution is free, open-source, and designed to be flexible. It includes a built-in ML algorithm module for direct data analysis. The data formats we used can be exported to several mapping software tools such as ArcGIS, Google Maps, and QGIS. This data-format agnostic platform not only simplifies deployment, but it also eases integration with other open-source software, and lowers the financial barrier of launching products that require GIS for data management, processing, and decision-making.
Overview
The Sample Solution combines a backend engine that contains:
Machine learning
Geospatial analysis and visualization modules
A front-end for web deployment
A database for data actions all bound together using Docker
A containerized microservices architecture
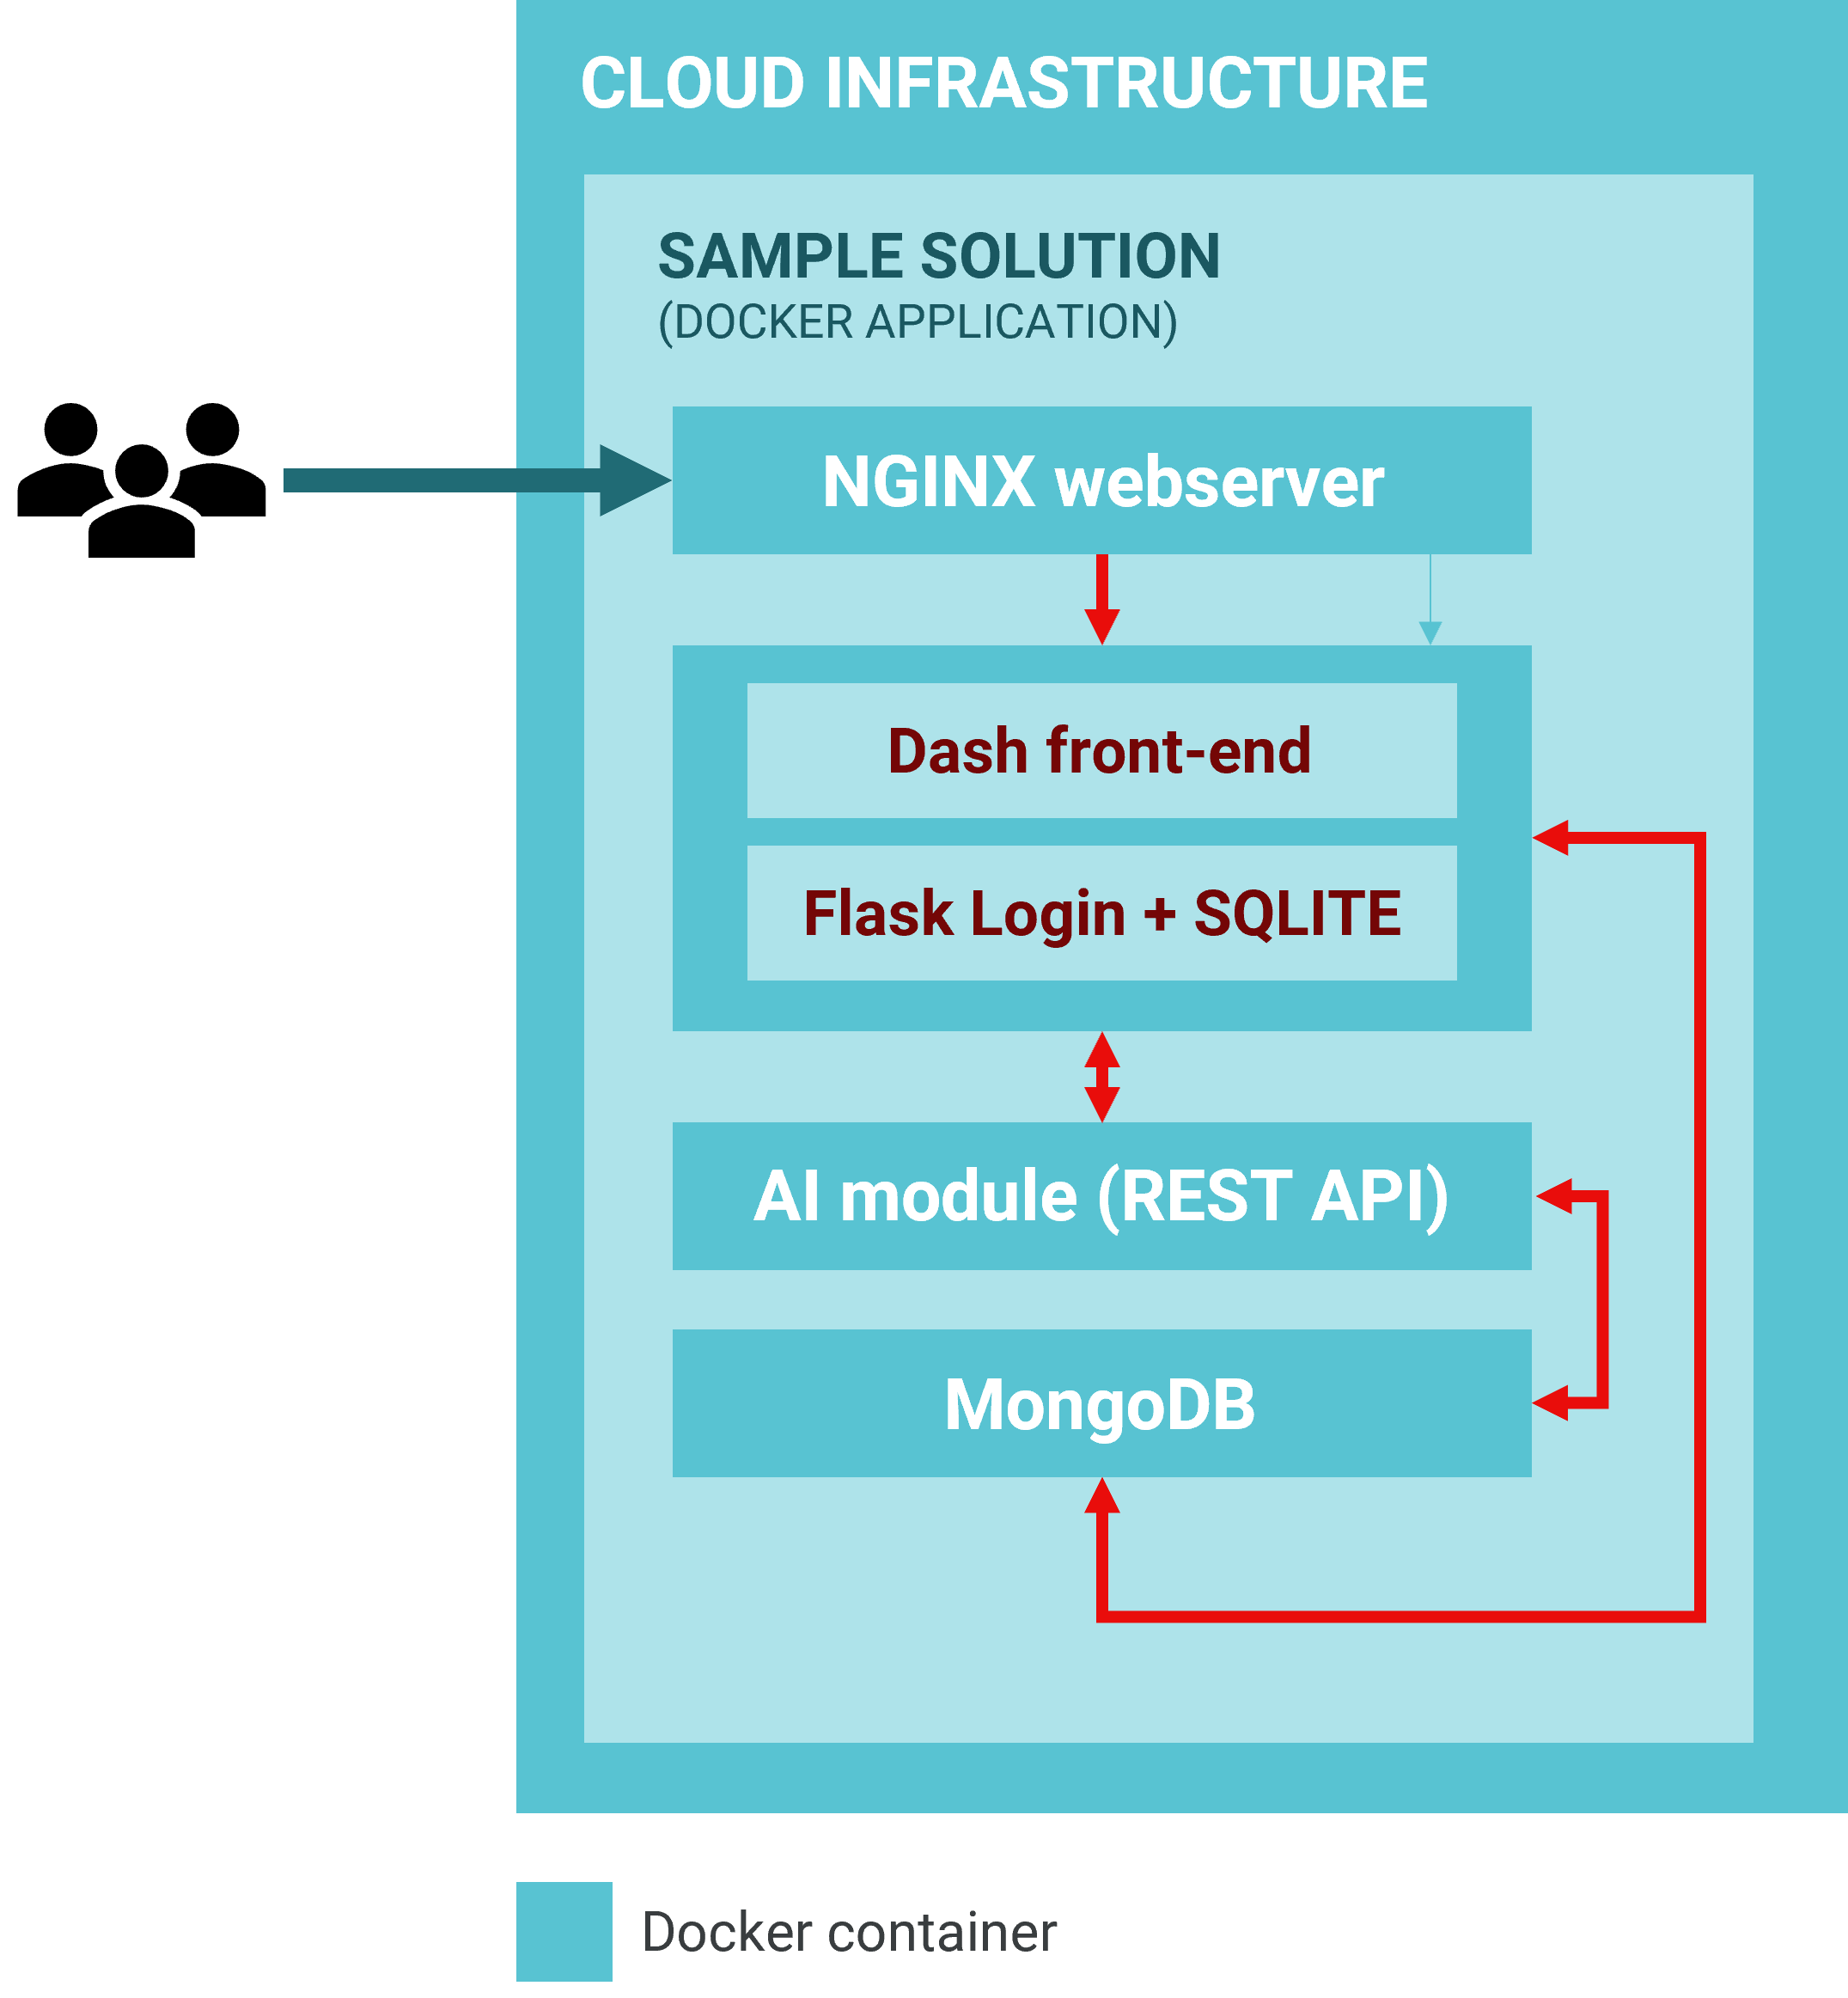
Sample Solution Overview Diagram
The diagrams below illustrate the structure of the Sample Solution.
Cloud Infrastructure
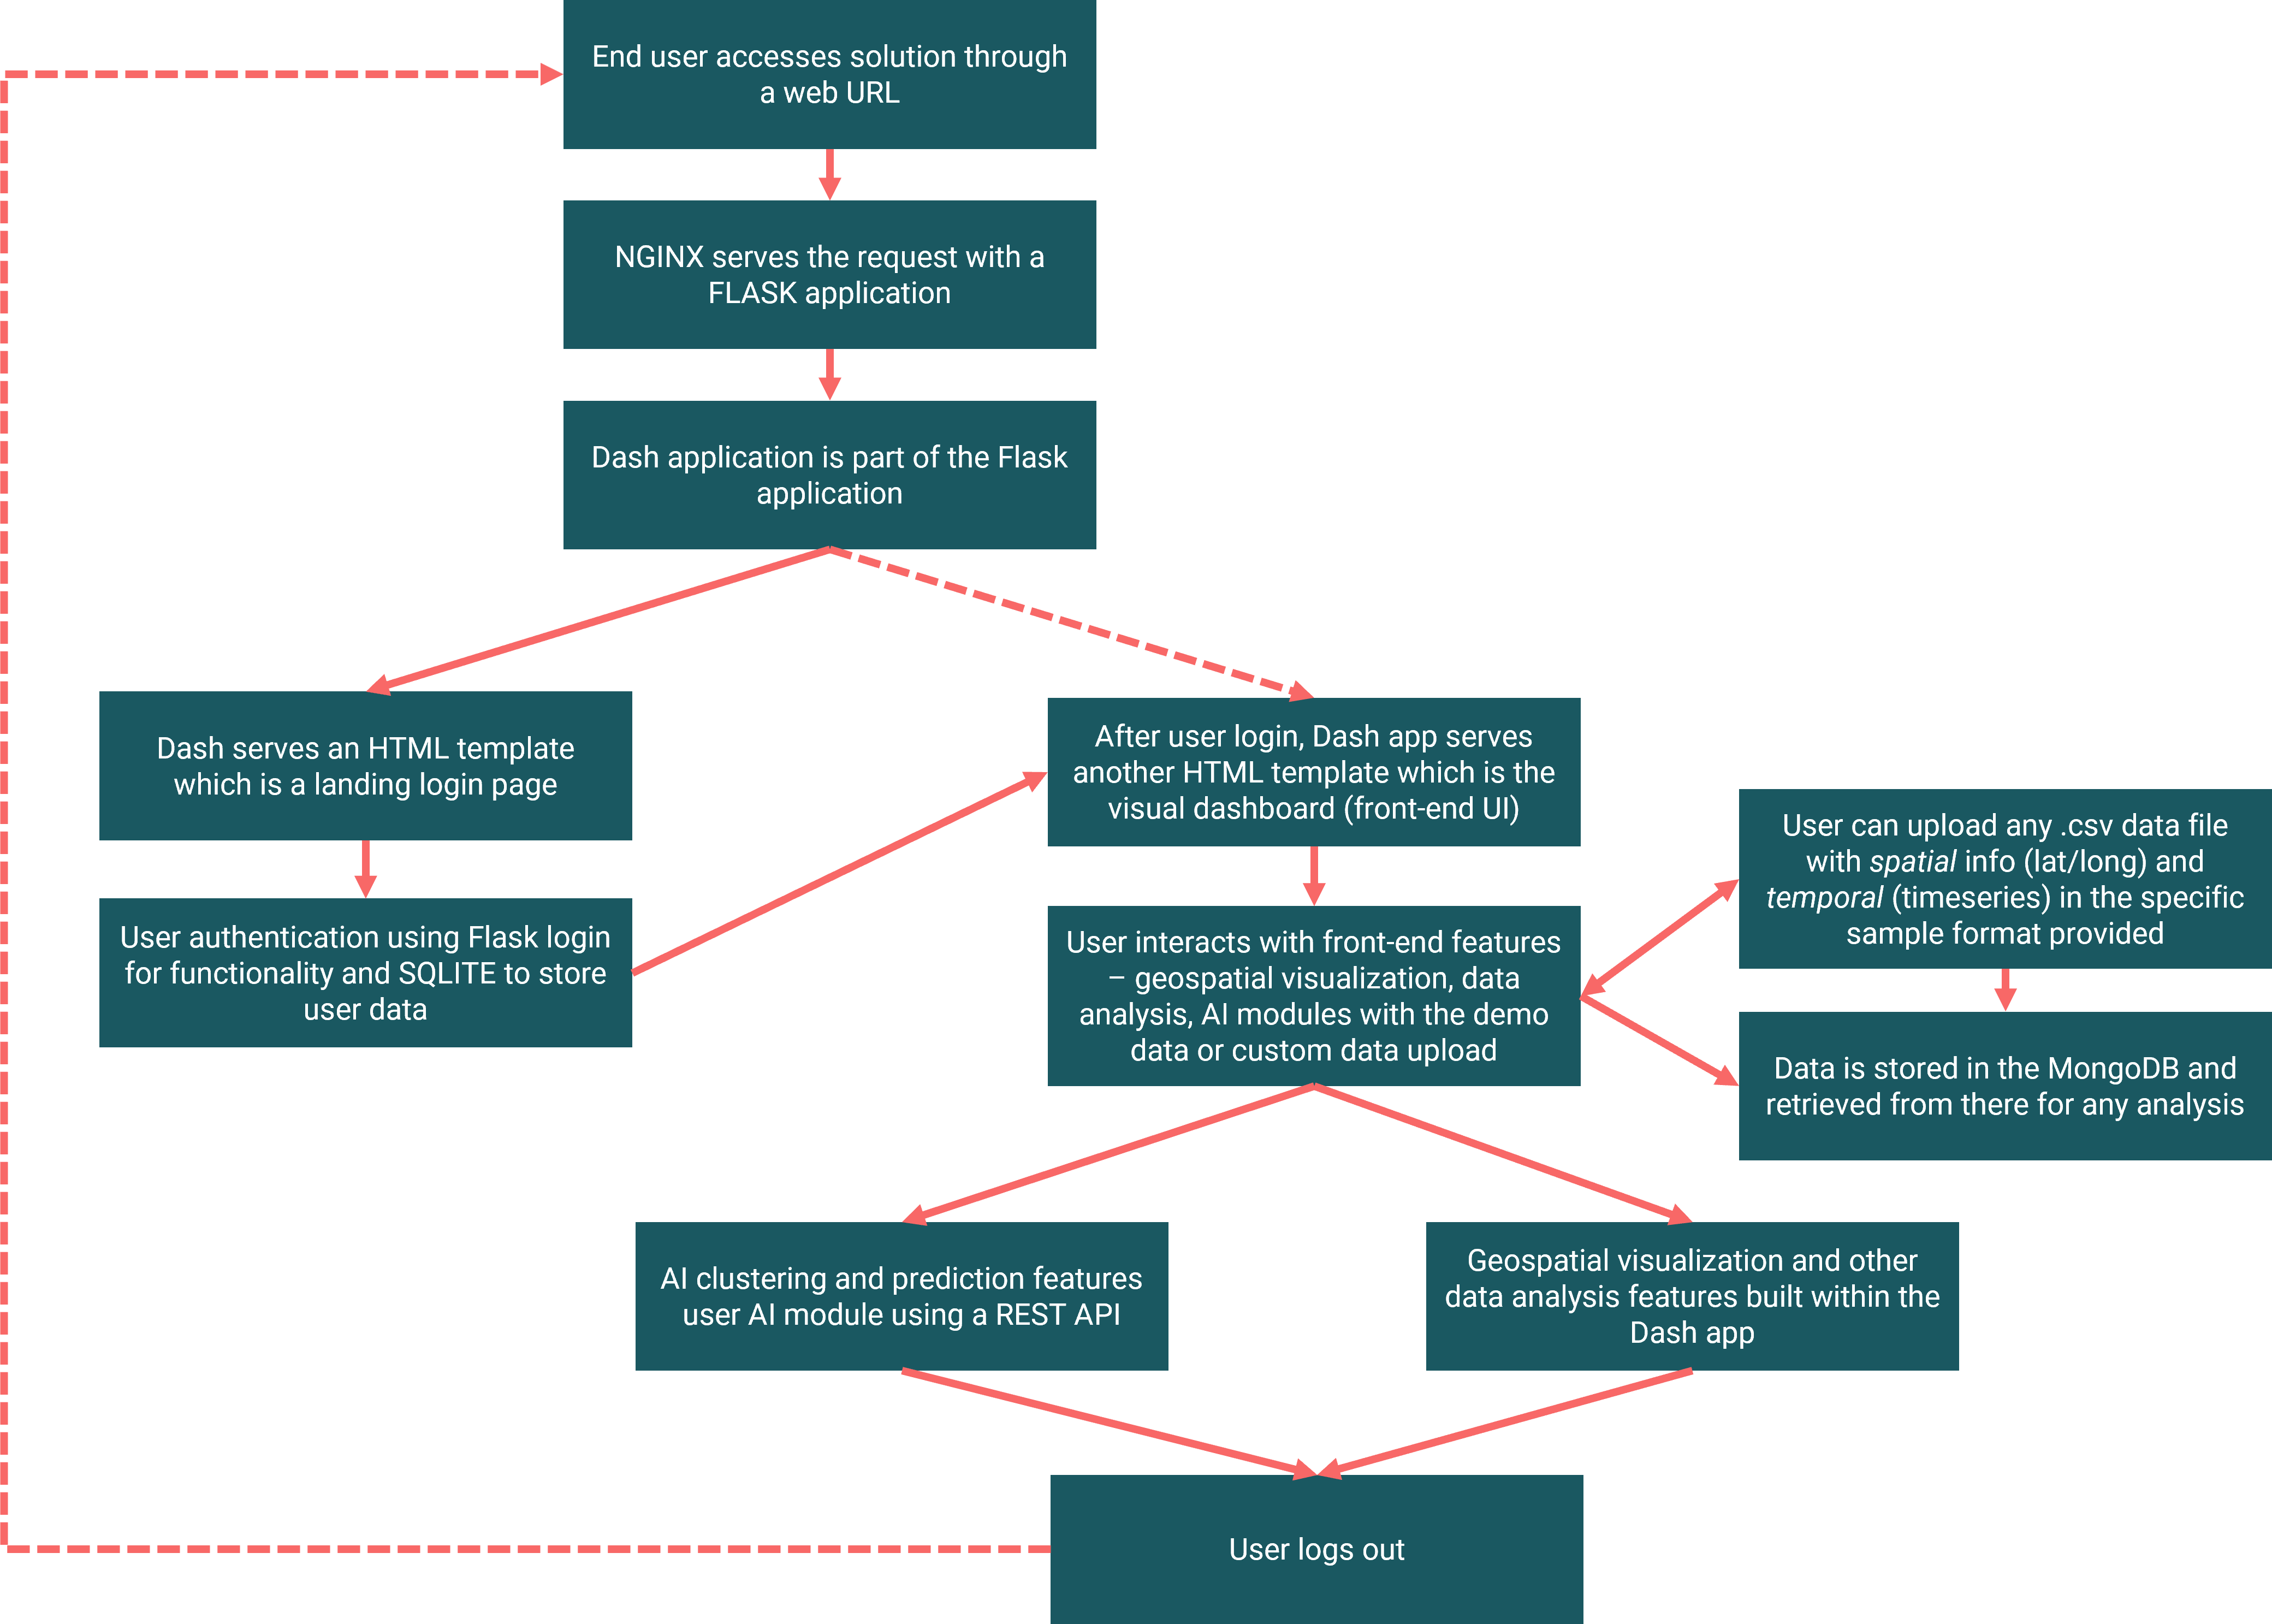
WORKFLOW
Component Descriptions
Significant components used in the Sample Solution are summarized below:
A Python-based Flask application that contains:
Front-end module built with Dash plotly (in Python), which forms the core of the data analysis and geospatial visualization. Dash has several advantages including but not limited to Dash apps are rendered in the web browser, they can be deployed to VMs or Kubernetes clusters and then share them through URLs. Since Dash apps are viewed in the web browser, Dash is inherently cross-platform and mobile ready.
A user-access module (built in python) Flask Login module and a simple SQLITE database that is used as a data store for user access authentication data. This module can be replaced with a more complex user access system like Auth0, Okta, AWS Cognito or a custom built JWT authentication module.
Machine learning module (built in Python) that is presented with two different machine learning algorithms:
one supervised (ANN’s with LSTM), and
one unsupervised (K-means clustering).
These algorithms can be replaced with other algorithms, or further tailored to fit the specific application (as long the formats of the input and output is maintained)
MongoDB, a NOSQL database module that is the data store for all the data.
MongoDB can be run anywhere, from a laptop to a data center making it extremely scalable. MongoDB has a fully managed cloud solution to build faster and scale further. There are several Python libraries (with pymongo being the most popular and the one used in this Sample Solution) that can be used to interact with a mongo database.
A web server module using NGINX, an open-source software for web serving, reverse proxying, caching, load balancing, media streaming, and more.
It started out as a web server designed for maximum performance and stability and is now widely popular due to its lightweight footprint and its ability to scale easily on minimal hardware.
All the components above are packaged into a microservices architecture using Docker. Docker builds individual containers for each service (front-end, AI, mongo, NGINX). This unlocks a key advantage: Portability
Once you’ve tested your containerized application you can deploy it to any other system where Docker is running and your application will perform exactly the same when you tested it.
The portability and performance benefits offered by containers can help make your development process more agile and responsive. Enhancing your continuous integration and continuous delivery processes to take advantage of containers and technology, such as Enterprise Developer Build Tools for Windows, can make it easier for you to deliver the right software at the right time.
A Docker container that contains one of your applications also includes relevant versions of supporting software that your application requires. If other Docker containers house applications that require different versions of the same supporting software, that’s fine because different Docker containers are totally independent.
As you move through the various stages of your development lifecycle, the image you create during development will perform the same as it moves through testing and potentially to your users.
You can quickly create new containers if demand for your applications requires them. When using multiple containers, you can take advantage of a range of container management options. See the Docker documentation for more information.
Assumptions before deploying the Sample Solution:
You have set up a security group rule that allows you to SSH (TCP port 22) into VMs that are spun up in the DAIR Cloud from the IP you are accessing the VM.
A DAIR account is required for the deployment of the GAIT BoosterPack within its cloud space. The application is deployed using a Linux instance.
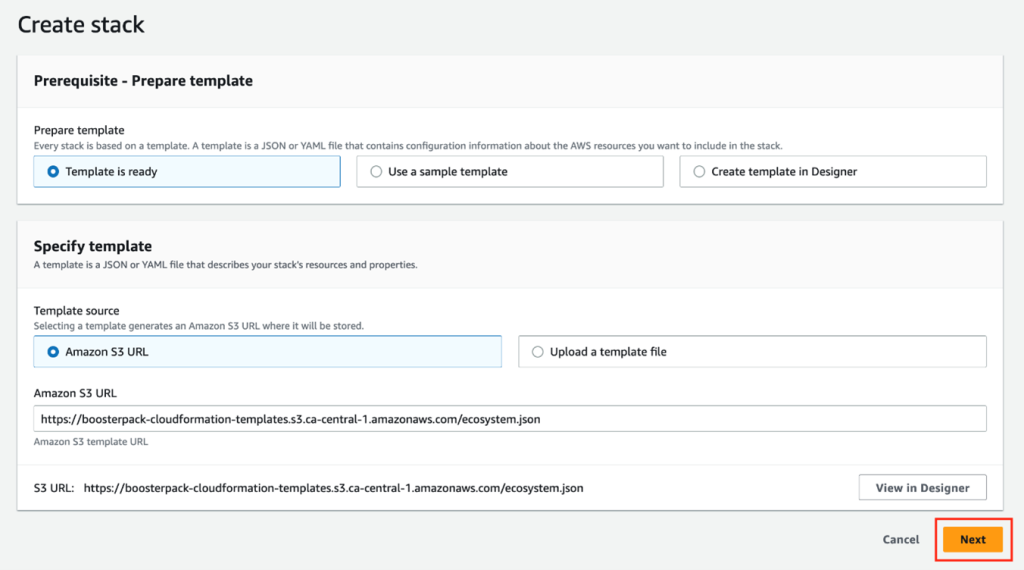
From the DAIR BoosterPack catalogue page, go to the Ecosystem Informatics section and click DEPLOY to launch the BoosterPack using AWS CloudFormation stack.
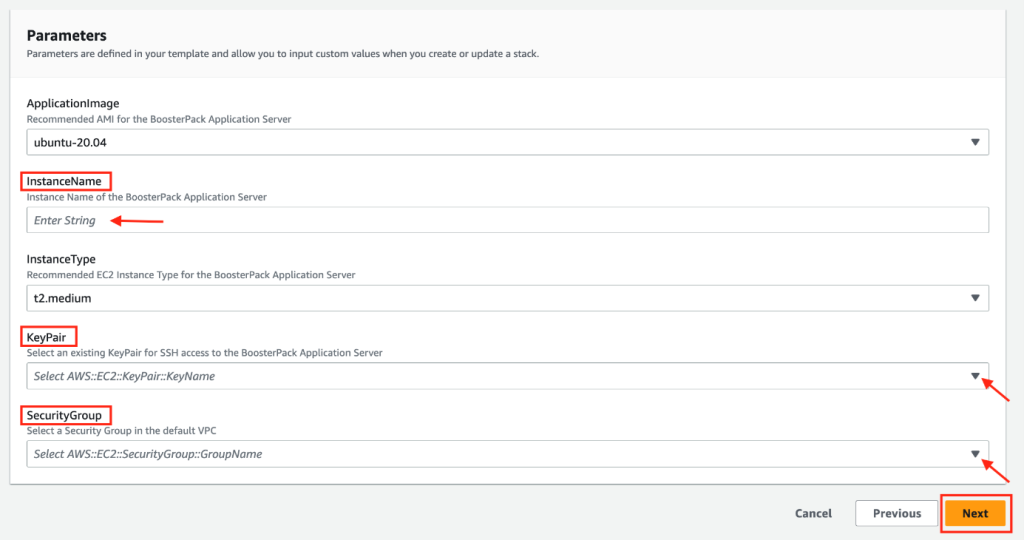
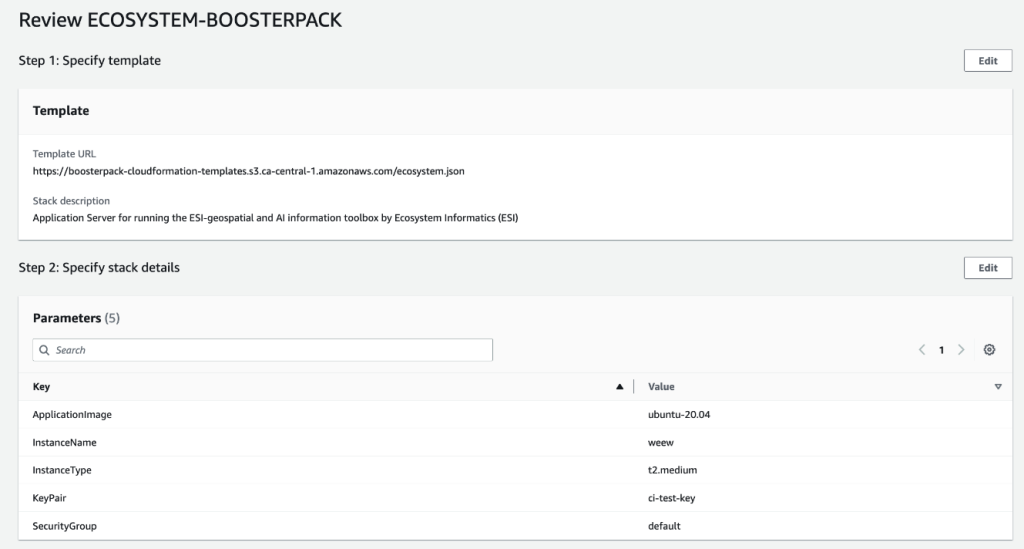
Click Next to go to CloudFormation step 2 and fill out the parameter configuration form. In the InstanceName field, type in a unique instance name for your application server and then complete the rest of the form using the drop-down options. Please note that parameters (such as “ApplicationImage” and “InstanceType”) are pre-configured and cannot be modified.
Click NEXT to go to CloudFormation step 3. This section is for configuring additional/advanced options which are not required in our use case. Simply click Next at the bottom of the page to skip step 3 and get to the final CloudFormation step.
The final section allows you to review existing BoosterPack configurations and provides options, if needed for making configuration changes, using the Edit button. Once satisfied with the existing configuration, click Submit at the bottom of the page to deploy the BoosterPack.
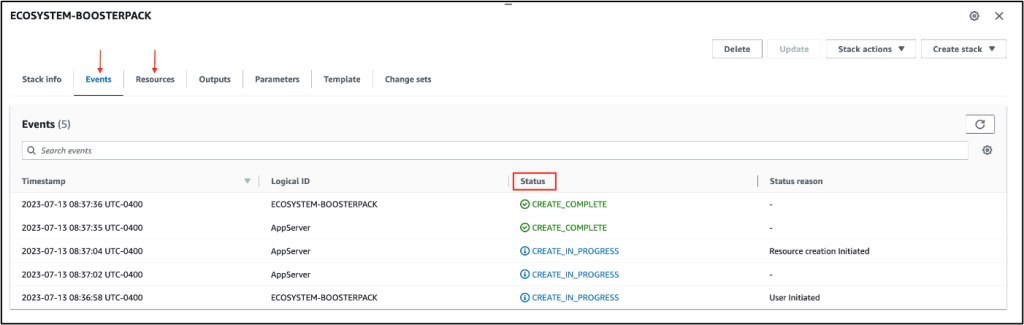
The BoosterPack deployment will start by creating a new instance and the deployment automation will follow. However, you can only monitor the AWS instance status through the “Events” and “Resources” tab of the CloudFormation page – you will need to log in to the application server to confirm the deployment automation status.
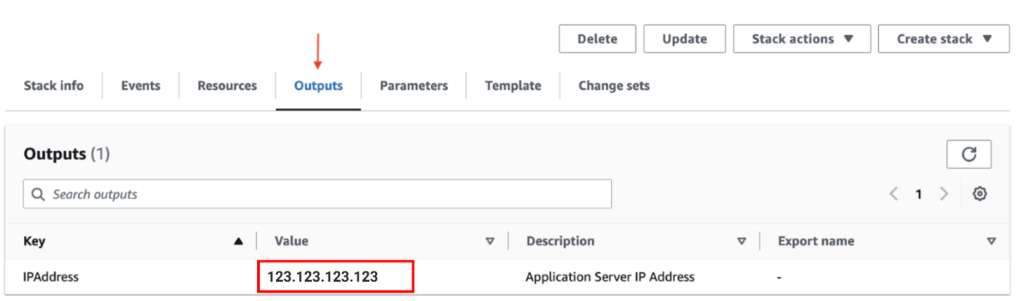
Note: Record the IP address value found under the “Outputs” tab of the BoosterPack CloudFormation page. This is the external IP of the instance that is being created. You will need this IP address to access the web interfaces of the sample application or to login to the server using SSH.
Launching the Application
From a shell/terminal that has SSH enabled, log in to the application server with the following SSH command:
>ssh -i key_file.pem ubuntu@IP
Replace “key_file” with the private key of the SSH key pair selected in the CloudFormation parameter configuration form and replace “IP” with the IP Address value obtained from the CloudFormation output.
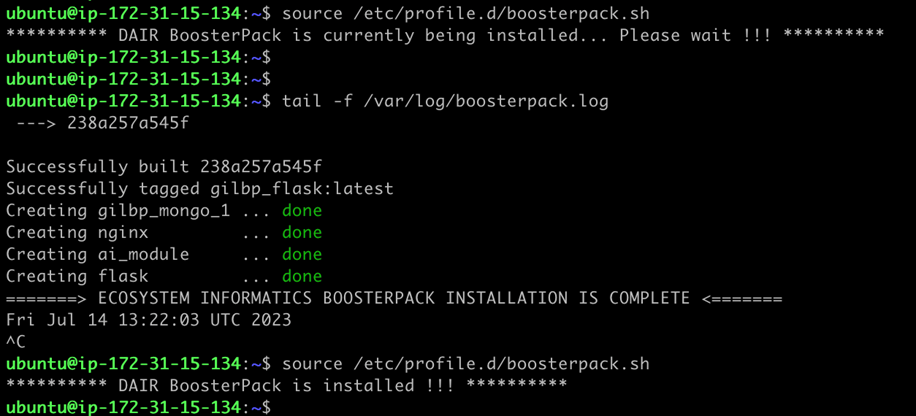
Once successfully logged in to the application server, you can monitor the status of the deployment automation script with the following commands:
>source /etc/profile.d/boosterpack.sh
>tail -f /var/log/boosterpack.log
The BoosterPack deployment, including the automation script, can take about 10 to 15 minutes to be completed, then the application launches automatically post-instantiation.
Ensure that the security group selected to be used with this VM contains rules allowing inbound access to SSH (port 22), and HTTP (port 80) from your external IP address so that only you can access the VM.
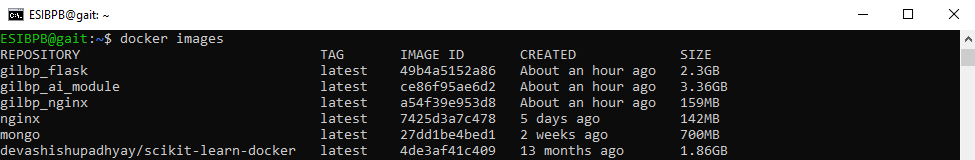
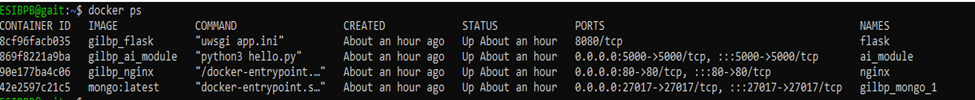
To verify the BoosterPack application is deployed successfully and running, run the following Docker command from the application server terminal:
>docker image
>docker ps
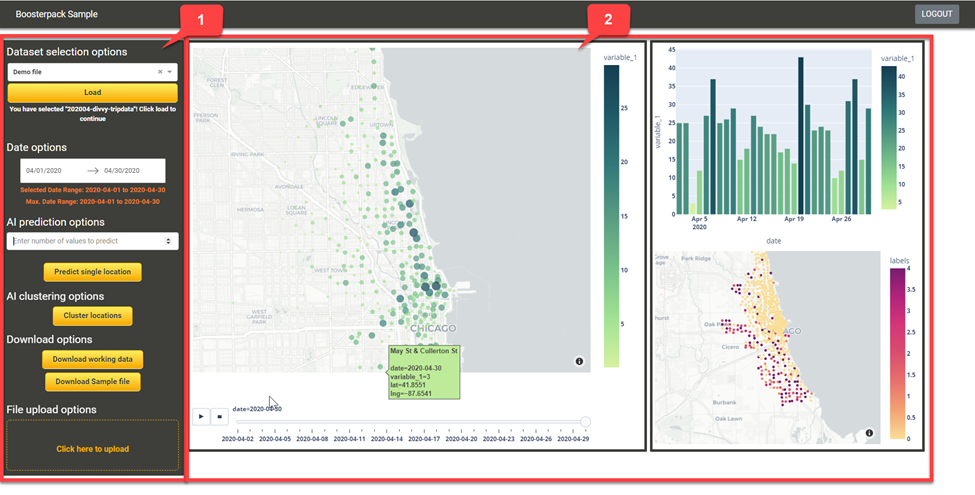
The user interface is accessible via a web browser using the assigned EIP, and the designated application port (port 80) in the format:<External.IP.Address>:80
The screenshot above shows the user interface with a functional control panel on the left side and the visualization on the right. In the visualization, the label variable_1 represents the entity we want to predict and visualize which is part of the required upload file format but variable_1 can signify anything depending on the input. For real-estate data, variable_1 could represent house prices or for crime data, variable_1 could represent number of thefts.
The browser-based application can perform several key functions, the details are outlined below.
(1) Functional Control Panel
Dataset selection dropdown and Load button
Allows the user to select the dataset which they want to work on; clicking the Load button loads the dataset as the current working dataset for the application.
Demo file
The Demo file is part of the Sample Solution and is present by default for the sample user, created with the credentials mentioned earlier. After logon, the user has the option to select the Demo file from the dataset dropdown and load its data by clicking Load. Alternatively, the user can upload their own data in the specified format (see table below). Once uploaded, the file can be selected from the drop down to be loaded.
The Demo file contains public data from Divvy’s trip data. Divvy is a Chicago area bike share system. The data was downloaded from their website: https://ride.divvybikes.com/system-data
The data itself consists of:
Spatial fields
Trip start station (Name, ID, latitude and longitude)
Trip end station (Name, ID, latitude and longitude)
Temporal data
Trip start day and time
Trip end day and time
Other feature data
Rider type (Member, Single Ride, and Day Pass)
This data was transformed to fit into the format suited for this tool (as given below)
lat
lng
variable_1
varriable_1_id
variable_1_name
date
In this example:
lat and lng – represents the start station’s latitude and longitude coordinates,
variable_1 – represents the number of trips originating from this station,
variable_1_id – represents the station ID,
variable_1_name – represents the station name,
date – represents the date relative to the trip count from this station
Date options
Allows users to select a date range which is picked up from data loaded. This allows flexibility for the user to analyze/visualize based on a date range if desired.
AI prediction options
Several AI algorithms can be used to analyze datasets containing spatial and temporal data. In this Sample Solution, we apply a basic Neural Network AI technique to predict future time-series values based on existing values. The sample application allows the user to input any integer value which signifies the number of future time series points that the AI algorithm is required to predict. Clicking the AI prediction button results in the automatic update to the visualization (graphs) based on the integer value.
There are two ways to use the AI prediction.
By selecting any one of the bubbles on the map section and predict future number of trips (variable_1) originating from that specific station (variable_1_id)
Select a geographical area (using the polygon draw tool on the map) that has multiple bubbles and predict the future number of trips (the sum of variable_1 for all the bubbles or stations) within the user-drawn polygon
AI clustering options
Several AI algorithms can be used to analyze datasets that contain spatial and temporal data. One of the basic algorithms is the k-means clustering algorithm. Clustering is the process of dividing the population or data points into multiple groups so that the data points in Group A are more similar to the other data points in Group A than in Groups B to Z.
The aim is to segregate groups with similar traits and assign them into clusters. The k-means algorithm finds groups in data, with the number of groups represented by the variable k. Clustering helps us understand our data in a unique way by grouping or dividing data into clusters. k-means clustering can be used in almost every domain, ranging from banking to recommendation engines, cyber security, document clustering, to image segmentation.
In the case of the Demo file, we are using this algorithm to analyze bike trip data which provides useful insights into urban traffic patterns and helps plan for future cities. In this Sample Solution, the algorithm has been designed to cluster variable1_id and hence its unique location based on variable_1. Once the algorithm is applied, the output is a map visual (explained below) that shows how the different variable_1 IDs are clustered. This is helpful to establish locations with similar traits and for further analysis and planning.
Download sample file
Allows the user to download a CSV file to examine the format required by the application to process any uploaded files (containing your own data). Uploaded files that don’t follow the format of the sample file won’t be processed.
Upload file section
Allows the user to upload any dataset for analysis if the dataset is in the required file format.
(2) Visualization Panel
Map visual
This graphic allows users to visualize the geospatial information in the working dataset. The data in the variable_1 column is visualized as a bubble chart with the intensity of the data in variable_1 linked to the radius of the bubble. For example, the higher the value of variable_1, the bigger the bubbles. You can also visualize changes over a time by clicking on the play button at the bottom of the map.
Bar chart visual
This section visualizes the temporal information in the working dataset. It visualizes the sum of variable_1 for each time-period (days, weeks etc.) in the dataset. The bar chart will be blank until you click on a bubble in the map visual.
Map output visual
This section differs from the map visual (above), because it exclusively visualizes the output of the AI clustering algorithm.
Chart output visual
This section shows the output of the AI prediction algorithm. It displays both the current levels and the predicted levels in different colors for easy distinction.
Networking Considerations
Port 80 must be open to facilitate http access via the web browser.
Cost Considerations
The optimum resources for the application are met with the Amazon T2 Medium instance. These can be scaled up to offer growing data size and faster rendering of map tiles for computation and visualization. Docker Desktop is licensed as part of a free (Personal) or paid Docker subscription (Pro, Team or Business). For details, visit Docker’s licensing here.
Termination
Once you’re finished exploring the Sample Solution, stop the application to free up cloud resources for the DAIR community.
Return to the CloudFormation stacks page to delete the stack corresponding to the BoosterPack. More information about deleting a CloudFormation stack can be found here.
Factors to consider
technology alternatives
The solution is built to be highly modular and upgrade friendly. Each of the components can be updated for higher performance, capability, and scale.
The Dash application can be upgraded to a Dash Enterprise application (paid), which unlocks much more functionality and features around visualization and front-end experience.
The database module can be any database like MySQL, Oracle, AWS RDS etc. – essentially any database service.
security
For any production environment, a valid HTTPS certificate should be acquired and installed for the web application.
The Sample Solution provides a simple user access and authentication methodology using Flask login for authentication, session management, and a SQLITE database to store user access information. This is only a placeholder and should be upgraded for production. There are various options that can be chosen like AWS Cognito, Auth0, and Okta.
The login credentials are stored within a SQLITE database in the code package for the Sample Solution. The location of the database is in the module/folder named flask with the filename data.sqlite.
There are no admin credentials required to access the SQLITE database, however third-party open-source software is required to view and edit the user table within the SQLITE database. We suggest using DB Browser for SQLite Version 3.12.1. Once this software is installed, the user can open the data.sqlite file and change (then save) the default credentials.
Note: The solution is http but should be converted to https for security and for browser compatibility.
Scaling
Docker is used to develop the Sample Solution. Docker is a developer-oriented containerization platform that lets you package applications as standalone containers. They’ll run anywhere a compatible container runtime is available. There are several options to scale Docker containers.
The user interface is developed with Dash, which allows the developer to develop the entire solution in a single language, Python. This works well because the webpage is itself not complicated and nimble.
API
The AI module interacts with the other modules using a REST API. One of the key advantages of REST APIs is that they provide a great deal of flexibility. Data is not tied to resources or methods, so REST can handle multiple types of calls, return different data formats and even change structurally with the correct implementation of hypermedia.
License
Sample Application (Dash/Plotly for Python) is free and open-source software, licensed under the MIT license. It costs nothing to install and use. You can view the source, report issues or contribute using our Github repository.
The launch codes are present in the following GitHub repository: Launch code repo
Glossary
The following terminology, as defined below, may be used throughout this document.
Term
Description
API
Application Programming Interface
GIS
Geo-spatial Information System: A geographic information system (GIS) is a system that creates, manages, analyzes, and maps all types of data. GIS connects data to a map, integrating location data (where things are) with all types of descriptive information (what things are like there).
Container
A container is a standard unit of software that packages up code and all its dependencies, so the application runs quickly and reliably from one computing environment to another.
LSTM
Long Short-Term Memory (Network).
Machine Learning
Framework of building models without explicit programming.
Time-Series
A sequence of data taken at successive equal time-intervals.